
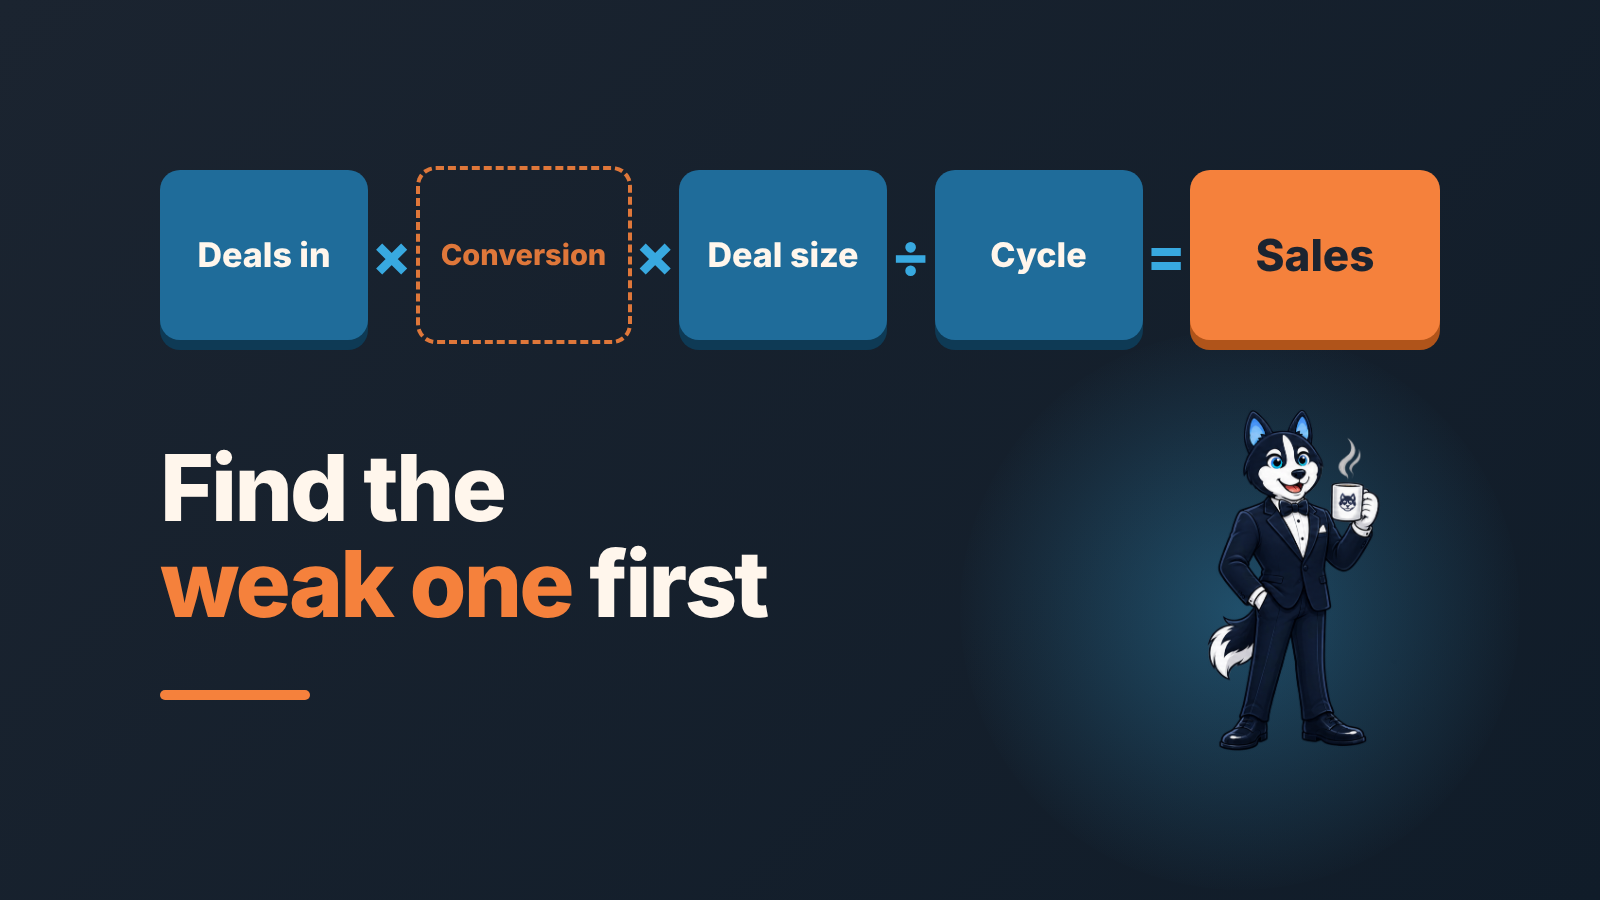
A sales team increases sales through four levers and nothing else: more deals entering the pipeline, a higher share of deals moving from stage to stage, a bigger average deal, and a shorter cycle (or, for teams with repeat business, more repeat orders). Every tip on how to boost sales is one of these four in disguise. Before you pick a tactic, open the CRM, take the last 90 days, find the lever that is weakest for your team right now and work on that one.
This article is for sales managers and owners of B2B teams that run deals in a CRM. It is not about retail, online stores or advertising budgets.
Quick answer: the four levers and the number behind each
Sales for a period is, roughly, the number of deals your team works multiplied by the share that close multiplied by the average size of a won deal. The cycle length decides how much of that lands inside the period you are measuring. Four levers, four numbers, and each one already sits in your CRM if deals are kept there honestly.
- More deals entering the pipeline, measured by new deals created per week, per rep and per source.
- Higher stage-to-stage conversion, measured by the share of deals that leave each stage forward rather than sideways to Lost.
- Bigger deals, measured by the average value of won deals and the share of won deals below your minimum size.
- Shorter cycle and more repeat orders, measured by days from created to won per stage and repeat purchases per customer.
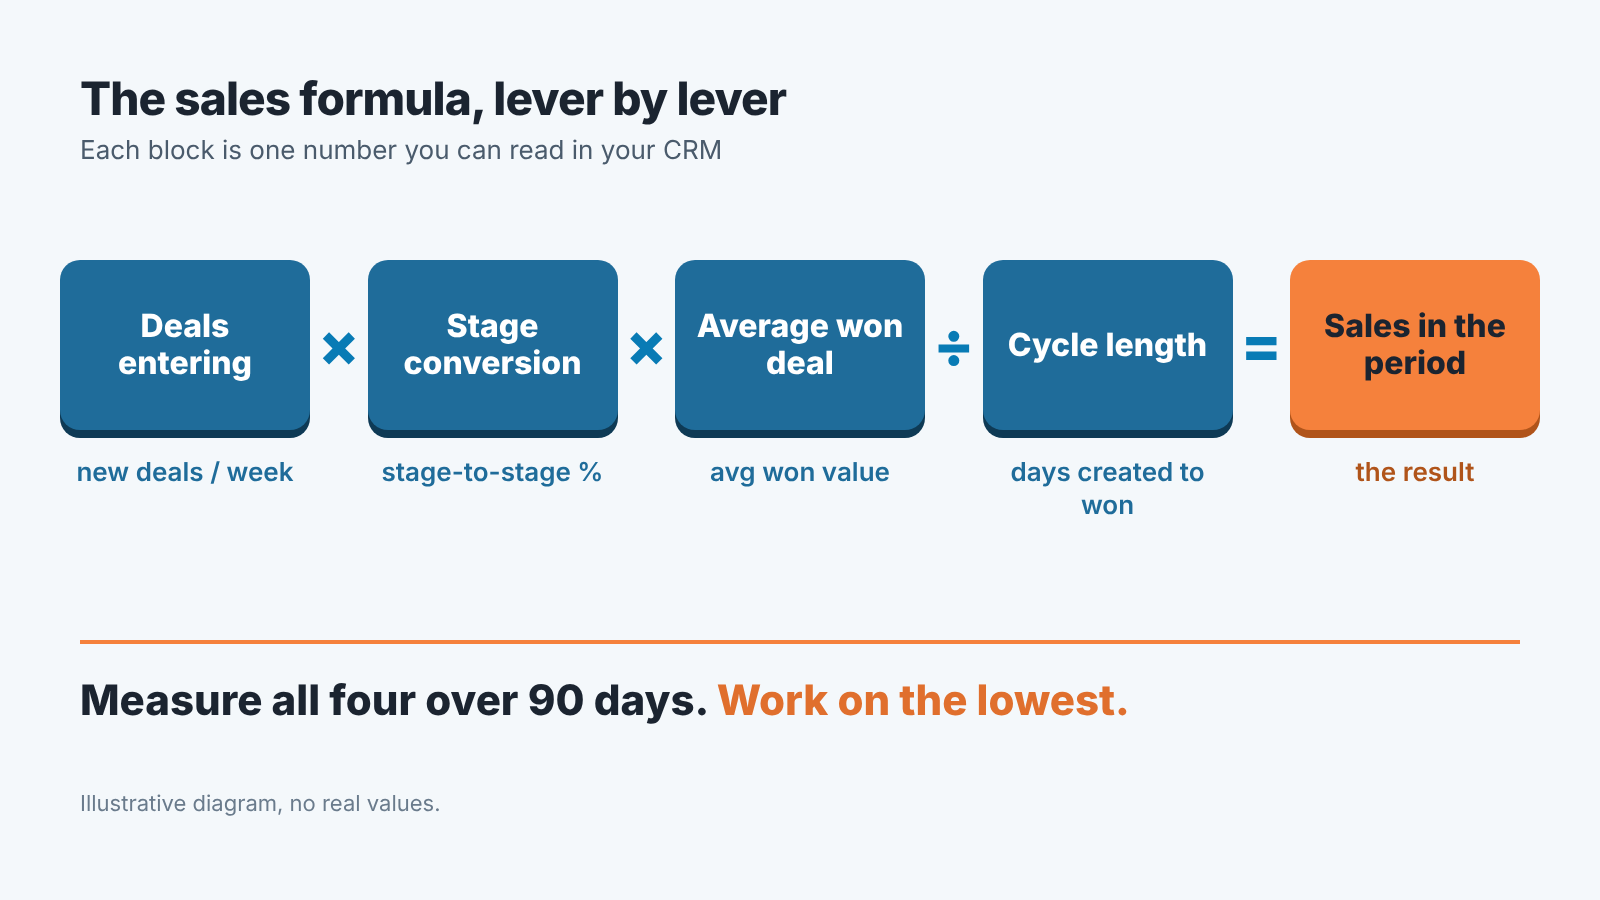
Two things before you use this list. The levers multiply, so a weak one drags the whole result down no matter how good the others are; a team with great conversion and no new deals still ends the quarter short. And the levers are not equally cheap to move. If you need to increase sales quickly, pipeline volume responds within weeks to a prospecting target. Conversion and deal size take a quarter of coaching and discipline. Cycle length takes longest, because it is mostly a property of how your buyers buy.
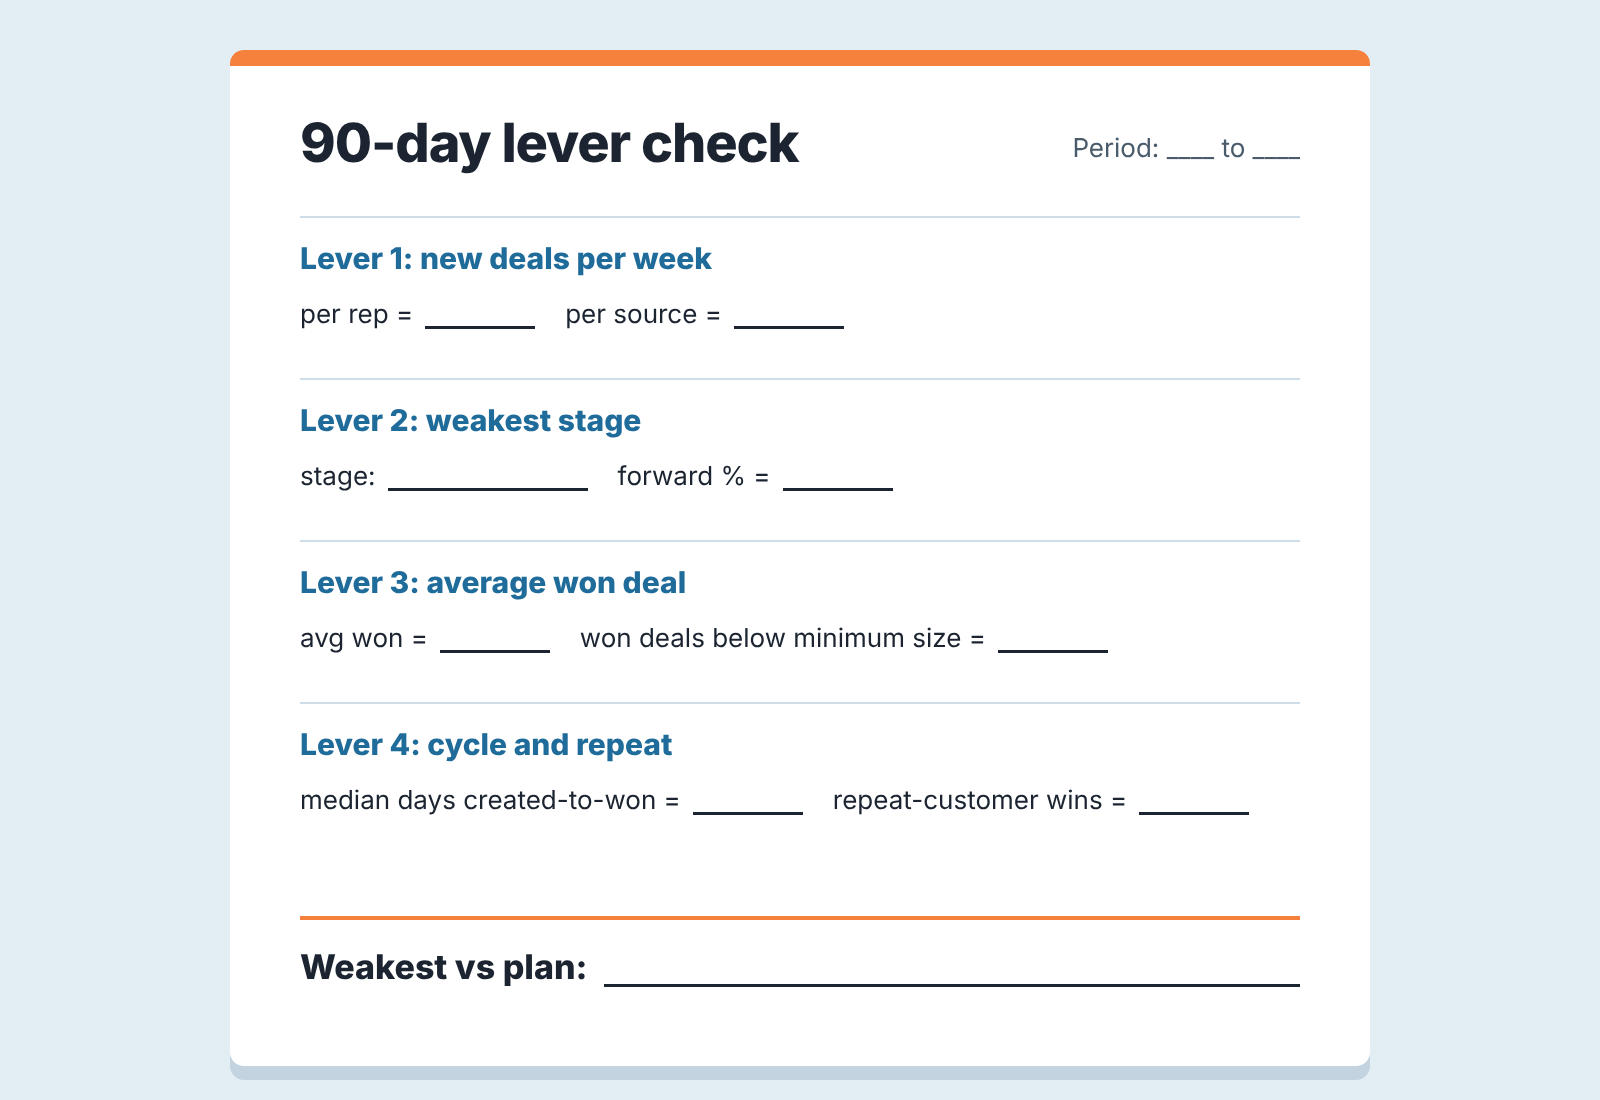
Find your weakest lever first: a 30-minute check on 90 days of CRM data
Pick 90 days because a month is too noisy for a team of five to ten reps and a year hides what changed. You need one filter and four reports.
Start with the won deals of the last 90 days. Write down three numbers from that list: how many deals won, the total value, and the average value per won deal. That average is Lever 3.
Now take every deal created in those same 90 days, won or not, and count them. Divide by 13 to get new deals per week. Split it by rep and by source if you have a source field. That is Lever 1. If the number per rep is uneven, you have already learned something no tactic list would tell you.
Next the pipeline conversion report. Every CRM names it differently, but the shape is the same: for each stage, what share of deals moved forward and what share went to Lost. Look for the stage with the biggest drop. That stage is Lever 2. Knowing which stage leaks is more useful than knowing the overall win rate, because the fix is different at each stage. We wrote a longer piece on this, with the arithmetic and the traps, in pipeline stage conversion rates: find the stage where your deals die.
Last, go back to the won deals and look at the gap between created date and won date. The median matters more than the average here, since one deal that sat for a year ruins the mean. That median is Lever 4. If your business has repeat customers, also count how many of the won deals came from organizations that had bought before. That second number is the other half of Lever 4.
Thirty minutes, four numbers, and now a question you can answer: compared with what the plan needs, which of these four is furthest off? Nobody has an industry benchmark for your team, and anyone who quotes you one is quoting someone else’s team. Compare against your own plan and your own previous 90 days.
That is also the honest answer when someone asks which strategies for increasing sales work best. The one aimed at your weakest lever. Short of deals, it is a prospecting target per rep with a source field behind it. Losing in the middle of the funnel, it is qualification fields and a fixed Lost reason list. Small deals call for a minimum size and a discount threshold, and late reorders for a weekly look at who is overdue.
A free CRM audit covers part of this check for you. SalesBond reads the last 30 days of the connected CRM and sends a PDF report covering managers and deal health, the pipeline bottleneck, repeat customers and up to five things to fix, sorted by money; seven days later a second PDF shows what changed. If you would rather have the numbers pulled than pull them yourself, check your CRM with SalesBond. Doing the 90-day version by hand still teaches you more the first time, because you see where the data is missing.
If reps create deals late, mark them won without a date, or skip the Lost reason, the four numbers will be wrong in ways you cannot see. A report won’t fix that. A handful of required fields and a weekly habit will, and we covered both in where CRM benefits actually show up.
Lever 1: more deals entering the pipeline
In small teams a thin pipeline is a weak lever we run into often, and it is the easiest one to misread. The symptom shows up at the end of the quarter as “conversion dropped,” when what really happened is that reps, short of deals, started pushing the weak ones forward to have something to report.
The number to manage is new deals created per rep per week. A deal here is an opportunity with a value, a company and a next step, and leads and contacts do not count. Three questions tell you whether the volume is a problem.
Is it enough to cover the plan? Work backwards: the quarter’s target divided by the average won deal gives the number of wins you need; that divided by your overall win rate gives the number of deals that must enter the pipeline; that divided by the weeks left gives the weekly target. The same arithmetic sits behind pipeline coverage, the ratio of open pipeline value to the part of the plan still to close. The full calculation, with a per-rep version, is in how many new deals each rep must add per week. Run it once and you will know whether Lever 1 is the problem at all.
You may have met this arithmetic as the 10-3-1 rule, a traditional activity formula among insurance advisors: 10 qualified prospects lead to 3 booked appointments, which lead to one new client, over time rather than at once. Coach Jim Ruta names the late Al Granum as its likely father and calls it “a strict formula” (Insurance Portal: Persistence drives success of 10-3-1 formula). Treat it as an example of the method. Your own 90 days of CRM data give you the real numbers for prospects, meetings and wins, and they will not be 10, 3 and 1.
Where do the deals come from? A deal source field with five or six fixed values (inbound, outbound, referral, partner, existing customer, event) turns a vague feeling about “marketing isn’t delivering” into a count. If 70 percent of your won deals came from referrals and existing customers, and the team spends it’s prospecting hours on cold outbound, the pipeline is thin for a reason that has nothing to do with effort.
Is the volume even across the team? One rep creating twice as many deals as the others is either your best prospector or your most optimistic one, and the stage conversion report by rep will tell you which.
What moves this lever: a weekly creation target per rep that the manager actually looks at on Monday, a fixed source list so the counts mean something, and a rule that a deal gets created at the first real conversation. The last one matters more than it sounds. A team that creates deals at proposal stage shows a wonderful conversion rate and a pipeline that is useless for forecasting, because everything before the proposal is invisible.
Lever 2: higher stage-to-stage conversion
Coaching time tends to go here, and often to the wrong stage. The overall win rate (won deals divided by all closed deals, won plus lost) is one number for the whole funnel, so it cannot tell you where to look. Stage conversion can.
Read the report from the top. The first drop, from a new deal to a qualified one, is usually about qualification: deals that should never have been created, or that were created without a budget, a decision maker or a date. If the drop there is large, the fix is a stricter entry rule. A short set of qualification fields, filled before a deal can leave the first stage, raises this number faster than any closing technique, because it stops the unqualified deals from counting at all.
The middle drops, demo to proposal and proposal to negotiation, are where selling skill shows. This is where a Lost reason field pays for itself. Price, timing, competitor, no decision, went silent: five fixed values are enough. After 90 days you can sort the Lost deals at each stage by reason and see whether the team loses in teh middle on price (a pricing or deal-size question, Lever 3) or on “went silent” (a follow-up discipline question). We described a small team’s version of this in win-loss analysis for a small team: ten deals, five questions.
The last drop, negotiation to won, is often a pile rather than a drop. Deals that sit in the final stage for months with the close date pushed every week are stuck. They inflate the pipeline, flatter the forecast and hide the real conversion. A stage age limit, after which the deal is either moved back or closed as Lost, makes the report honest, and the honest report is the one you can manage.
If you change things here, change them in this order: qualification fields at the first stage, a fixed Lost reason list, a stage age limit, and only then coaching aimed at the one stage that leaks most.
Lever 3: bigger deals
Say your won deals average 4,000 and the plan assumes 6,000. You can close the gap by winning more deals, which is Levers 1 and 2 again, or by changing what a deal is. Three things change the average, and only one of them is a selling skill.
The first is what you refuse. A team of six that spends a third of its time on deals under a certain size will have a low average and a tired team. Setting a floor, and routing anything below it to a lighter process or a partner, raises the average without a single bigger win. The reasoning and the arithmetic are in setting a minimum deal size for a small sales team.
The second is discounting. Pull the won deals with the value at creation and the value at close, if your CRM keeps a history, or compare the proposal amount in the notes with the final amount. If, say, every deal loses 10 to 15 percent in the final stage, you are looking at a habit rather than at negotiation, and it shows in the Lost reasons too: a team that discounts routinely still loses on price, because the discount has become the expected opening. We think a manager should approve any discount above a fixed threshold. Reps can be trusted; the point is the pause the approval creates, in which the rep has to say what the customer gave in return.
The third is expansion: upsell and cross-sell to customers you already have. Upselling sells a more expensive version of what the customer already wants or has, such as more seats, a higher tier or a longer term; cross-selling adds a different product that fits next to the first. Shopify’s guide offers an easy way to remember it: “upselling means better models, while cross-selling means matching accessories” (Shopify: what is upselling). For a sales team, expansion is also a bookkeeping question, because an expansion recorded by editing the old won deal vanishes from every report. Record each one as a new deal on the customer’s organization, with a field saying which kind it is. The setup is in upsell vs cross-sell: how a small team tracks account expansion. And if prices have not moved in three years, what you need is a price increase; sort the customer list before you send the letter, as described in price increase letter to customers.
A minimum deal size, a discount approval threshold, expansion deals tracked as deals. Of the four levers this is the one where a single policy decision, made on a Tuesday, can change the number by the next quarter.
Lever 4: shorter cycle and repeat sales
The cycle is the lever managers can do least about and worry about most. Buyers take the time they take. What you can do is stop adding your own time on top of theirs, and find out where you are adding it.
Measure the cycle per stage, and only then end to end. A deal that takes 60 days from created to won may be spending 5 days in qualification, 10 in demo and 45 waiting for a proposal that takes the rep a week to write and the customer a month to read. The stage breakdown shows whether the time is yours or the buyer’s; the end-to-end number does not. Sales cycle: how long a deal should sit in each stage walks through setting those stage limits and what to do when a deal passes one.
Two habits shorten the part of the cycle that belongs to you. Every open deal has a next activity with a date, and on Monday a deal without one is a problem to fix, however long the rep has been “thinking about” it. And the proposal is sent within a fixed number of days of the meeting that asked for it, which is a number you can read straight from the activity log.
Then there is the half of this lever that most “how to increase sales” lists skip entirely: repeat purchases. If your customers buy more than once, the cheapest sale in the pipeline is the one from a customer whose reorder is due. Open the organization records of your top customers and look at the the dates of their won deals. A customer who bought every quarter for two years and has gone quiet for five months is late, and nobody noticed, because CRM reports are built around deals rather than customers.
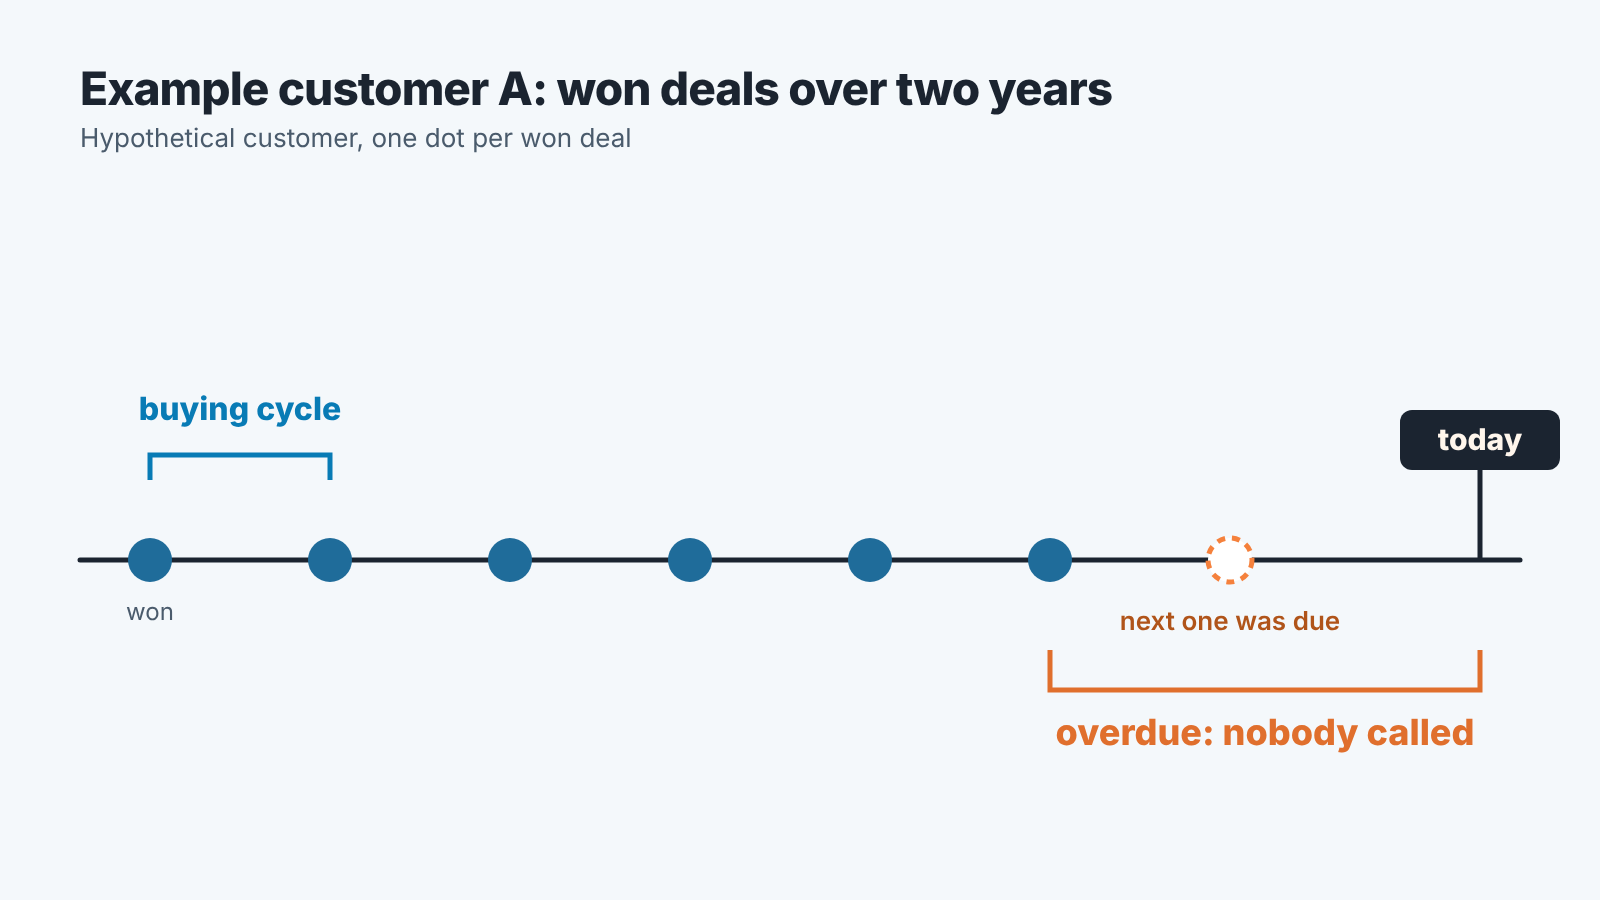
Repeat Sales in SalesBond works from exactly this idea: it takes each customer’s won deals, finds the typical interval between purchases, and marks the customer on track, overdue or leaving by how long it has been since the last one. Overdue customers appear as cards in Sales GPS, and accepting a card creates one task in the CRM for the rep. You don’t need the tool to start, though. The list of late customers exists in your CRM today as a pattern of dates, and somebody should be looking at it every week.
What this article leaves out on purpose
Advertising, pricing strategy, landing pages, checkout flow, discounts for first-time buyers and the rest of the online-retail playbook. Those are real ways to increase sales for a business that sells to many anonymous buyers, and they are what most of the search results for this phrase are about. They are not what a sales manager with eight reps and a CRM can act on this month. If you run an online store, the four levers still hold in principle, but the numbers live in your analytics, and the actions are different.
A 4-week plan to increase sales, one number a week
This is a plan for a sales manager who has done the 30-minute check and found the weak lever. Run the weeks in your own order, the week of your weakest lever first. Each week owns one number, and the Monday meeting looks at that number and nothing else.
Week one is pipeline volume. Set the weekly creation target per rep from the plan arithmetic above, put the deal source field on the create form as required, and read the count on Friday. Say nothing about conversion this week, even if it is terrible, a team that is told to create more deals and convert more deals in the same breath will do neither.
Week two is the leaking stage. Take the one stage with the biggest drop and sit in on, or read the notes of, every deal that left it for Lost in the last month. Agree on one change to the stage’s exit rule, written down. If the stage is qualification, that change is a required field. If it is proposal, it is probably a deadline.
Week three is deal size. Decide the minimum deal size and the discount approval threshold, announce both, and check the average won value at the end of the week against the 90-day average, knowing that one week is too short to prove anything. The purpose of this week is the policy.
Week four is time. Every open deal gets a next activity date or a conversation about why not. Pull the list of customers whose last purchase is older than their usual gap and give each one to a rep as a named task. Count how many of those become deals by the end of the month.
After four weeks redo the 30-minute check on the latest 90 days. Pipeline volume can move in four weeks; conversion and deal size take a quarter, so read those two for direction only. If even the volume did not move, the problem is in the data or the discipline rather than the tactic, and the article to read next is the one on sales growth rate from CRM closed-won deals, which is about measuring growth without fooling yourself. If you want the four on one dashboard, start there; sales analytics software on top of your CRM is the article in this series about what SalesBond adds to it.
If you want the four numbers pulled from your CRM without doing the filters yourself, start with SalesBond.


