AI deal scoring estimates a deal’s chance of closing from how similar past deals behaved: how recently the buyer replied, how many contacts are involved. Vendor guides put the minimum at 100–200 closed deals, won and lost. A smaller team should read the score as a prompt to open the deal, and back-test it on its last 20 closed deals.
We build SalesBond, an AI mentor that sits on top of Pipedrive, so we spend a lot of time looking at what a score can and cannot know about a deal. This is the plain-words version: what goes into a score, why a few dozen deals is not enough history, how a score misleads while sounding sure of itself, and a spreadsheet test that takes an afternoon.
What actually goes into a deal score
Start with the split that the search results blur. Lead scoring ranks people and companies before there is a deal: job title, company size, which pages they visited. Deal scoring ranks open deals that already exist in your pipeline, and the inputs are mostly things your reps did or logged. Different question, different data. If you would rather build the score yourself from deal and activity fields, Pipedrive Scores lets you set the criteria, and we walk through how to build a deal score your reps will actually trust.
A deal score is a pattern match against history. The model is trained on closed-won and closed-lost deals and learns which traits went with which outcome. Vendors describe the traits in roughly the same terms: how often and how recently the buyer responded, whether meetings happened, how fast replies came back, and how many stakeholders are on the deal and how senior they are (Spotlight.ai, Fullcast). In Pipedrive terms that means the activities logged on the deal and their dates, the participants attached to it, the stage history, the expected close date and how many times it moved, and the amount.
Some platforms skip the cold start by shipping a model trained on other companies’ deals. Spotlight.ai promises useful scoring right away and then 60 to 90 days of tuning to your data. That helps on day one, but the starting model has never seen your team sell.
Then the model applies the pattern to open deals. If deals on your team that went quiet for three weeks in Proposal usually ended up lost, an open deal that has been quiet for three weeks in Proposal gets marked down. If deals with a buyer-side sponsor and a technical contact tended to close, a deal with both gets marked up. The number on the screen is the model’s estimate of how often deals that look like this one have closed.
Notice what the model is reading. Not the buyer. Your CRM’s record of the buyer, as typed in by the rep. Everything below follows from that.
Why forty deals is a rule of thumb with a decimal point
Fullcast’s guide to AI deal scoring puts the floor at 200 closed deals, 100 won and 100 lost, for a statistically significant model, and Coffee says most platforms need 100–200 closed deals of both kinds. Those are vendor numbers, not a law of statistics. But a team of four reps closing a handful of deals a month each is nowhere near them in year one, and the shape of the problem is easy to show with made-up numbers.
Take a hypothetical team with 40 closed deals: 24 won, 16 lost. The model notices that deals with three or more contacts attached won more often. How much more? There were 10 such deals, and 8 of them won, an 80 percent win rate against 53 percent for the other 30 (16 won out of 30). That looks like a strong signal. Now imagine two of those eight had gone the other way, which on ten deals is nothing unusual. Six of ten is 60 percent, and the signal is mostly gone. The model does not know which of those two worlds it is in. It just reports 80 and moves on.
It gets worse when you ask what else those ten deals have in common. In a forty-deal history, ten deals are likely to share a rep, or a quarter, or the pricing you used before the last change. The model cannot tell a buyer pattern from a rep pattern, because there is not enough history for them to come apart. So the score ends up encoding “deals Dana worked last spring did well”, presented as a decimal.
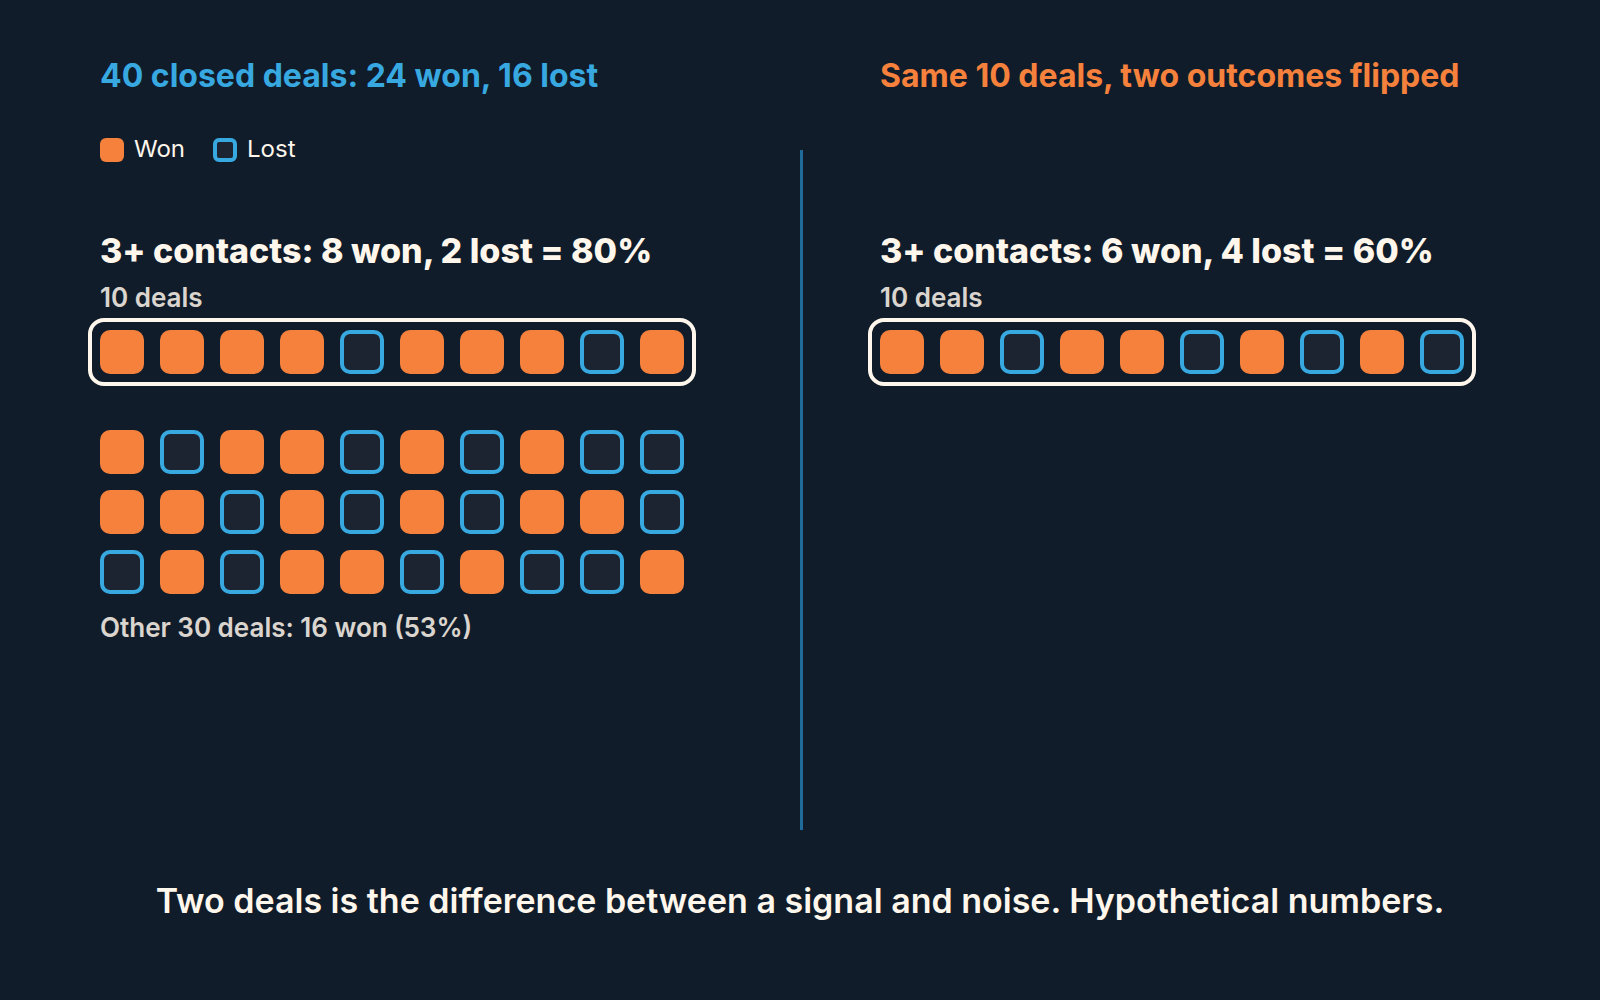
None of this makes the score useless at forty deals. It makes it a rough sort. Coffee’s own advice for teams under that 100–200 mark is to start with a rule-based formula rather than machine learning, which is close to what a manual deal health score is. Either way, expect the number to be wrong often enough that acting on it blindly costs you. How it is wrong matters more than how often.
Three ways a score lies with a straight face
The first is stale data scored as healthy. The score reads recency from what was logged, not from what happened. A rep who writes up the week’s calls on Friday afternoon makes every deal look active on Friday evening. A deal whose last note says “meeting booked” scores fine three weeks later if nobody logged that the meeting was cancelled. The score is not wrong about the data. The data is wrong about the deal, and the score has no way to notice.
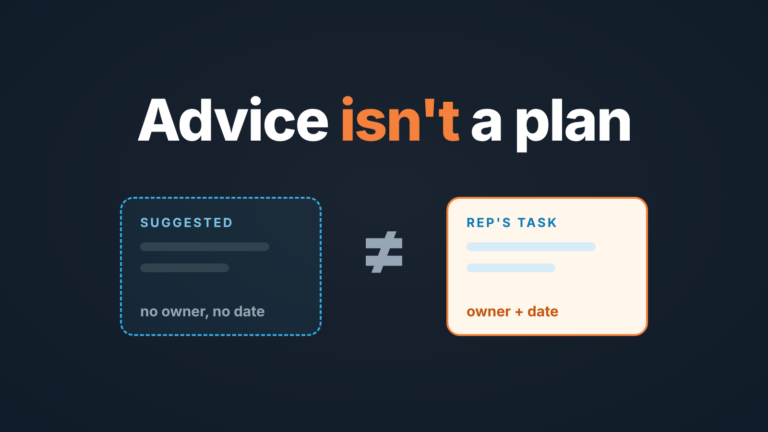
The second is a number nobody can explain. A deal sits at 71. Why 71? If the tool cannot show the two or three inputs that moved it, the number is unarguable in the worst way: the rep says “that deal is fine, the score is off”, the manager has no counter, and both of them learn to ignore it. Before you buy anything, ask the vendor to walk you through the breakdown for one real deal, and what the score was last week and why it moved. If the answer is a shrug, the number is decoration. This is also where a predictive score differs from a manual one: the manual score is slower to build, but every point in it has a name.
The third takes a quarter to show up. Reps learn what moves the score. If participant count raises it, reps add participants to thier deals. If logged activity raises it, activity gets logged. Soon the score is measuring how well the team feeds the CRM, which is a real thing but not the thing you meant to measure. The tell is a pipeline where scores drift up across the board while win rate stays flat.
A 20-deal back-test you can do in a spreadsheet
This is our method, not a vendor’s. It needs no code, only an export from Pipedrive and about an hour. If you use HubSpot, the lead-side version of this test is a one-hour check of lead scoring against real deals.
-
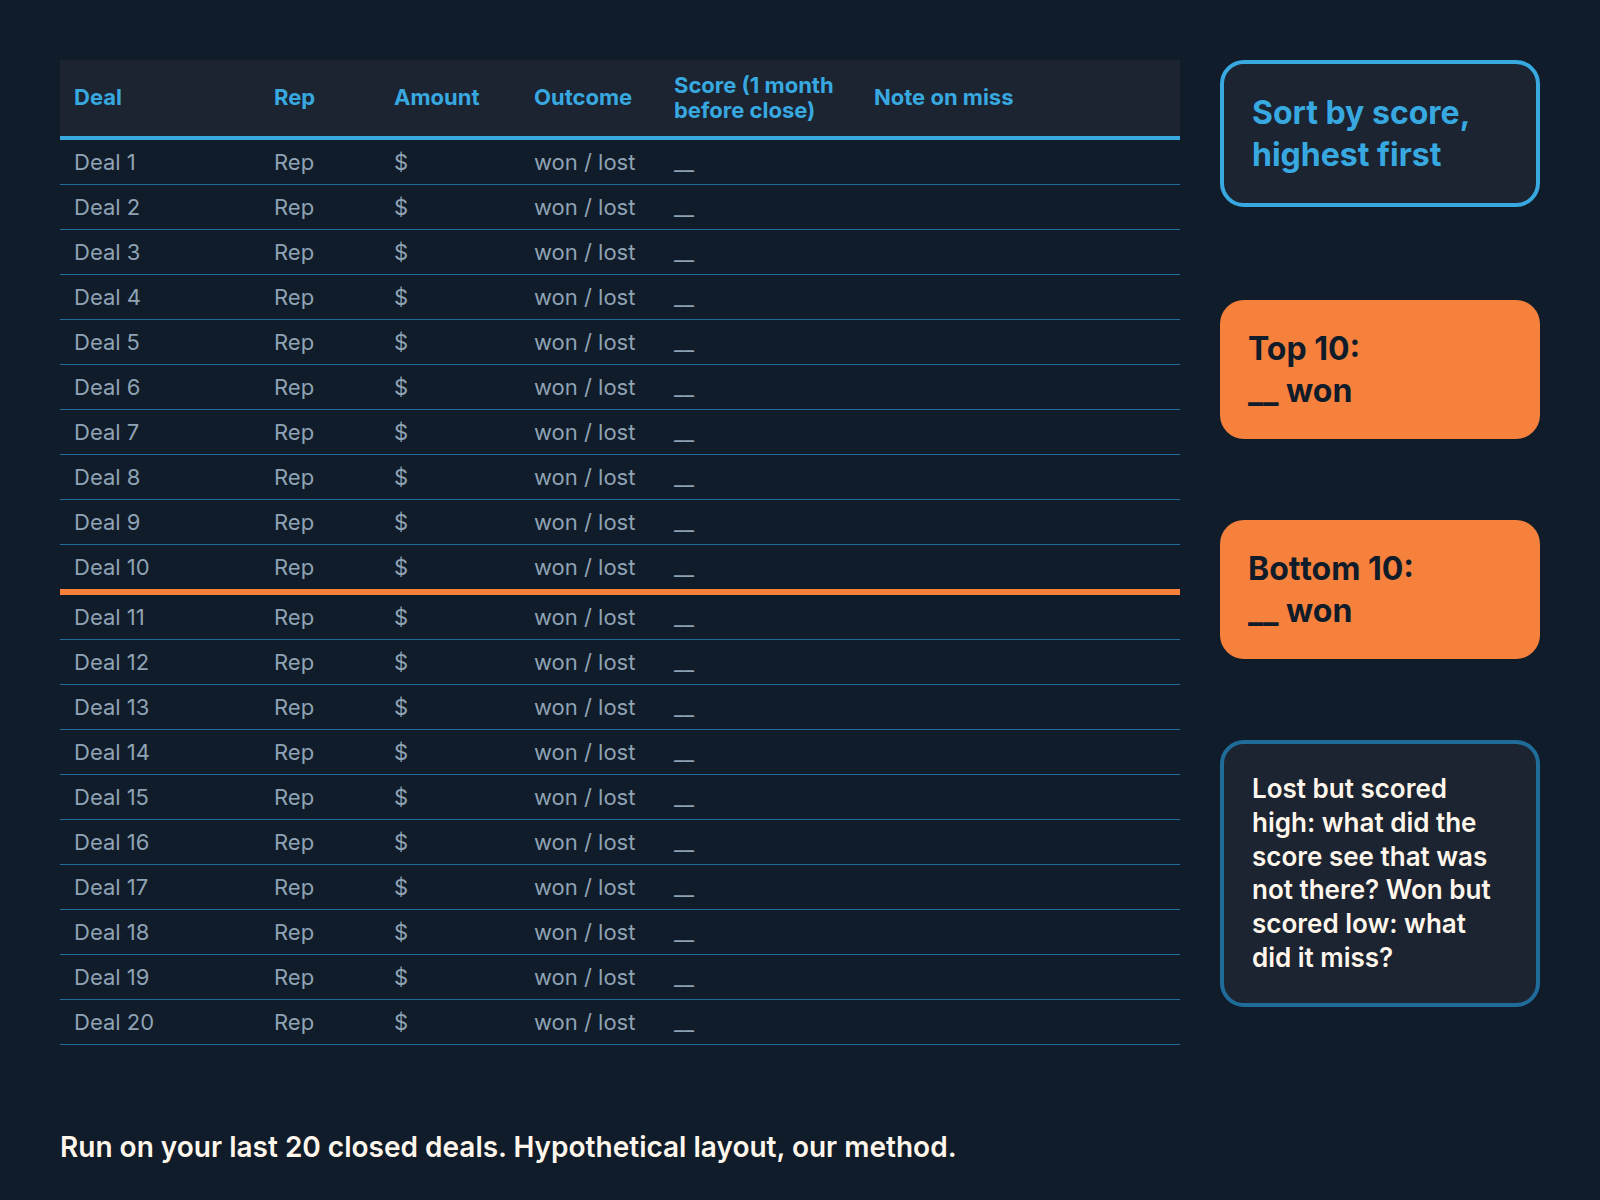
Export your last 20 closed deals to a spreadsheet: title, rep, amount, outcome (won or lost), close date. If your last 20 are all won, go back further until you have at least six lost.
-
Add a column for the score. If your tool keeps score history, use the score from about a month before each deal closed, not the score on closing day, because the day a deal closes the outcome is obvious to any model. If the tool does not keep history, run the forward version: score 20 open deals today, write the numbers in the sheet, and finish the test as they close over the next couple of months. Slower, but the same test.
-
Sort by score, highest first, and draw a line under the tenth row.
-
Count won deals above the line and below it. Hypothetically, 7 won in the top ten and 3 in the bottom ten means the score sorts something real on your team. 5 and 5 means it is noise for you, whatever it does for someone else. Anything in between is “weak, use with care”, which is where most small teams will land.
-
Read the misses, because that is the useful part. For every lost deal that scored high, write one sentence on what the score saw that was not there. For every won deal that scored low, one sentence on what it missed. You end up with a short list of things the model does not know about how your team sells, and that list is worth more than the hit rate.
Run it again a quarter later. A score that gets better as your history grows is doing what it should. One that stays at coin-flip after another forty closed deals is telling you something about your data, and the fix is in the CRM, not the model. If you run HubSpot, here is what the HubSpot deal score reads and how to check it.
Monday morning: five deals, not the forecast
Sort open deals by how much the score moved since last week, not by the score itself. The five lowest-scored deals are usually ones everyone already knows are dead. The five biggest drops are deals where something changed that nobody has talked about yet. Open those five.
Then one question per deal, to the rep: “This one dropped twelve points since Tuesday. What changed on their side?” Not “why is the score low”, which invites a debate about the tool. Sometimes the answer is that the buyer went quiet and now you know. Sometimes the rep has not logged two calls, and now the data gets fixed. Either way the score did its job. If a pattern shows up across one rep’s deals, it becomes a coaching topic rather than a scoring one.
Open two from the other end of the list too: the highest scores that no human has touched in two weeks. That is where the the stale-data problem hides, and a confident number on an untouched deal quietly inflates a revenue-at-risk view.
What the score does not do is replace the forecast. A deal score is a per-deal opinion with a small sample behind it. The forecast is a pipeline-level question with its own methods and failure modes; we have written about how AI forecasting works for a small team and what forecast accuracy you can expect separately. If you want a number for the quarter, a weighted pipeline built on your own stage conversion is more honest at this size than summing scores, because you can see every assumption in it.
A score is a reason to look. Put it next to the rep, the notes and the buyer’s last reply, and let it lose the argument when it should.
FAQ
How many closed deals does AI deal scoring need?
Vendor guides put it at about 100–200 closed deals, both won and lost; Fullcast says 200, split evenly. Below that, treat the score as a rough sort and back-test it on your own history. Before you pay for any of these, check the six CRM fields revenue intelligence platforms read first.
What is the difference between lead scoring and deal scoring?
Lead scoring ranks people and companies before a deal exists, using fit and website behavior. Deal scoring ranks open deals in the pipeline, using logged activity, contacts and stage history.
Can a small team trust an AI deal score?
Only after testing it. Sort your last 20 closed deals by the score they had a month before closing and see whether the top half won more often than the bottom half.